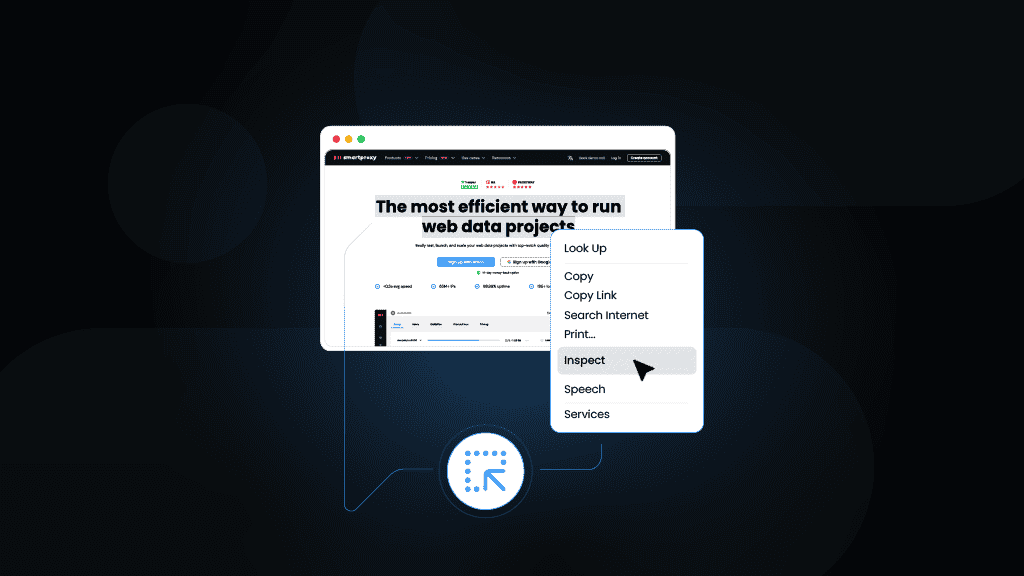
How to Inspect Element on Any Website
Accessible through Chrome Developer Tools, Safari’s Develop menu, and Firefox Web Developer Tools, the "Inspect Element" is a powerful feature used by web developers, digital marketers, and any ol’ internet users. It allows them to dive into the underlying structure of any website, including its HTML, CSS, and JavaScript, and analyze the page’s structure, test real-time code changes, or collect data for competitive analysis, among other purposes. In this blog post, we’ll explore the benefits of "Inspect Element" and how to use it effectively.
TL;DR
In Chrome, right-click on any webpage and select Inspect, or use the shortcut Ctrl+Shift+I on Windows or Cmd+Option+I on macOS.
In Safari, make sure you’ve enabled the Develop menu (Safari > Settings… > Advanced > Show features for web developers). Then, right-click on a webpage and choose Inspect Element, or use the shortcut Cmd+Option+I.
In Firefox, right-click on any webpage and select Inspect, or use the shortcut Ctrl+Shift+C on Windows or Cmd+Option+C on macOS.
What is Inspect Element?
"Inspect Element" is a key feature of your browser’s developer tools suite that allows you to view and interact with the underlying code of any webpage. Developers and designers often use it for debugging, testing code changes, and extracting data, as it lets you directly manipulate webpage content and immediately observe the effects.
While the interface of the "Inspect Element" feature may vary slightly between Chrome, Safari, and Firefox, the core functionalities are consistent. Here are the main panels you’ll find useful:
- Elements tab. Modify and inspect HTML for tasks like web scraping.
- Console tab. Test and debug JavaScript code.
- Sources tab. View and debug JavaScript, CSS, and other source files.
- Network tab. Monitor HTTP requests to discover hidden APIs and resources.
- Performance tab. Analyze the webpage’s performance, including load times and rendering speed.
- Application tab. Manage cookies, local storage, and session data.
These tools are especially valuable for dynamic websites or those built with frameworks like React or Angular, which often generate and manipulate HTML and CSS dynamically through JavaScript.
What are the use cases for Inspect Element?
A web browser's "Inspect Element" functionality enables you to access the website’s structure, which you can use for various tasks. Here are some of the most common use cases:
- Debug issues. Quickly identify and fix website code problems, such as layout issues, broken links, or malfunctioning scripts.
- Test code changes. Experiment with modifications to a webpage's design or functionality in real time without affecting the live site.
- Analyze website structure. Understand how a website is built, which is useful for learning web development or analyzing competitors’ sites.
- Gather data. Extract information, such as images, text, or styles, which can be helpful for writing custom web scraping code to be employed in SEO research, content strategy, competitive analysis, etc.
How to use Inspect Element?
Let’s review the different methods of accessing the "Inspect Element" interface on various platforms and browsers, including Google Chrome, Apple Safari, and Mozilla Firefox.
Google Chrome (Windows & macOS)
To open Chrome Developer Tools:
- On Windows and Chrome OS, press Ctrl+Shift+I.
- On macOS, press Cmd+Option+I.
Alternatively, you can right-click on the webpage or any webpage element and select Inspect.
For enhanced webpage viewing functionality, consider getting extensions like Web Developer, Wappalyzer, CSS Viewer, WhatFont, or another useful tool from the Chrome Web Store.
Apple Safari (macOS)
Before you can inspect elements in Safari on macOS, you must enable the Develop menu. To do this:
- Open Safari and go to Safari > Settings….
- Click on the Advanced tab.
- Check the box next to "Show features for web developers."
Then, to open the toolbox, you can use the shortcut Cmd+Option+I or right-click on the webpage or any webpage element and select Inspect Element.
Safari supports a range of extensions available through the Mac App Store. While Safari’s Web Inspector is quite powerful on its own, you can enhance its capabilities with extensions like HoverSee or Stylish. Install these by downloading them from the Mac App Store and following the prompts.
Mozilla Firefox (Windows & macOS)
To open Firefox Developer Tools:
- On Windows, press Ctrl+Shift+I.
- On macOS, press Cmd+Option+I.
Alternatively, you can right-click on the webpage or any webpage element and select Inspect.
Firefox also offers a range of add-ons for web development on their Extensions website, such as Firebug (now integrated into Developer Tools), Web Developer, and ColorZilla, which can further enhance your inspection and debugging capabilities.
Mobile devices (Android & iOS)
Inspecting webpage elements on mobile phones and tablets, whether Android or iOS, requires an approach involving connection to a computer.
Android (Google Chrome / Mozilla Firefox)
- Connect your Android device to your computer via USB.
- On your Android device, enable Developer Options and turn on USB Debugging (Settings > About Phone. Then, tap Build number 7 times to enable Developer Options).
- Open Chrome on both your Android device and your computer.
- On your computer, go to "chrome://inspect" in Chrome. You should see your Android device listed.
- Click Inspect next to the webpage on your Android device.
- Your computer will open Chrome Developer Tools, allowing you to inspect and debug elements on your Android device.
iOS (Apple Safari)
To inspect elements on an iPhone or iPad, use Safari's Remote Web Inspector, as Chrome and Firefox on iOS lack direct inspection tools.
Inspecting elements on iOS devices is slightly different from macOS because the Safari mobile browser doesn’t have a built-in Web Inspector. You can still inspect webpage elements on iOS by connecting your iPhone or iPad to a macOS device and using Safari’s Remote Web Inspector:
- Connect your iOS device to your Mac.
- Enable Web Inspector in Settings… > Safari > Advanced.
- Open the webpage on your device.
- On your Mac, go to Develop > [Your Device Name] in Safari. Select the webpage you want to inspect from the list.A Web Inspector window will appear on your Mac, allowing you to inspect and debug elements on your iOS device.
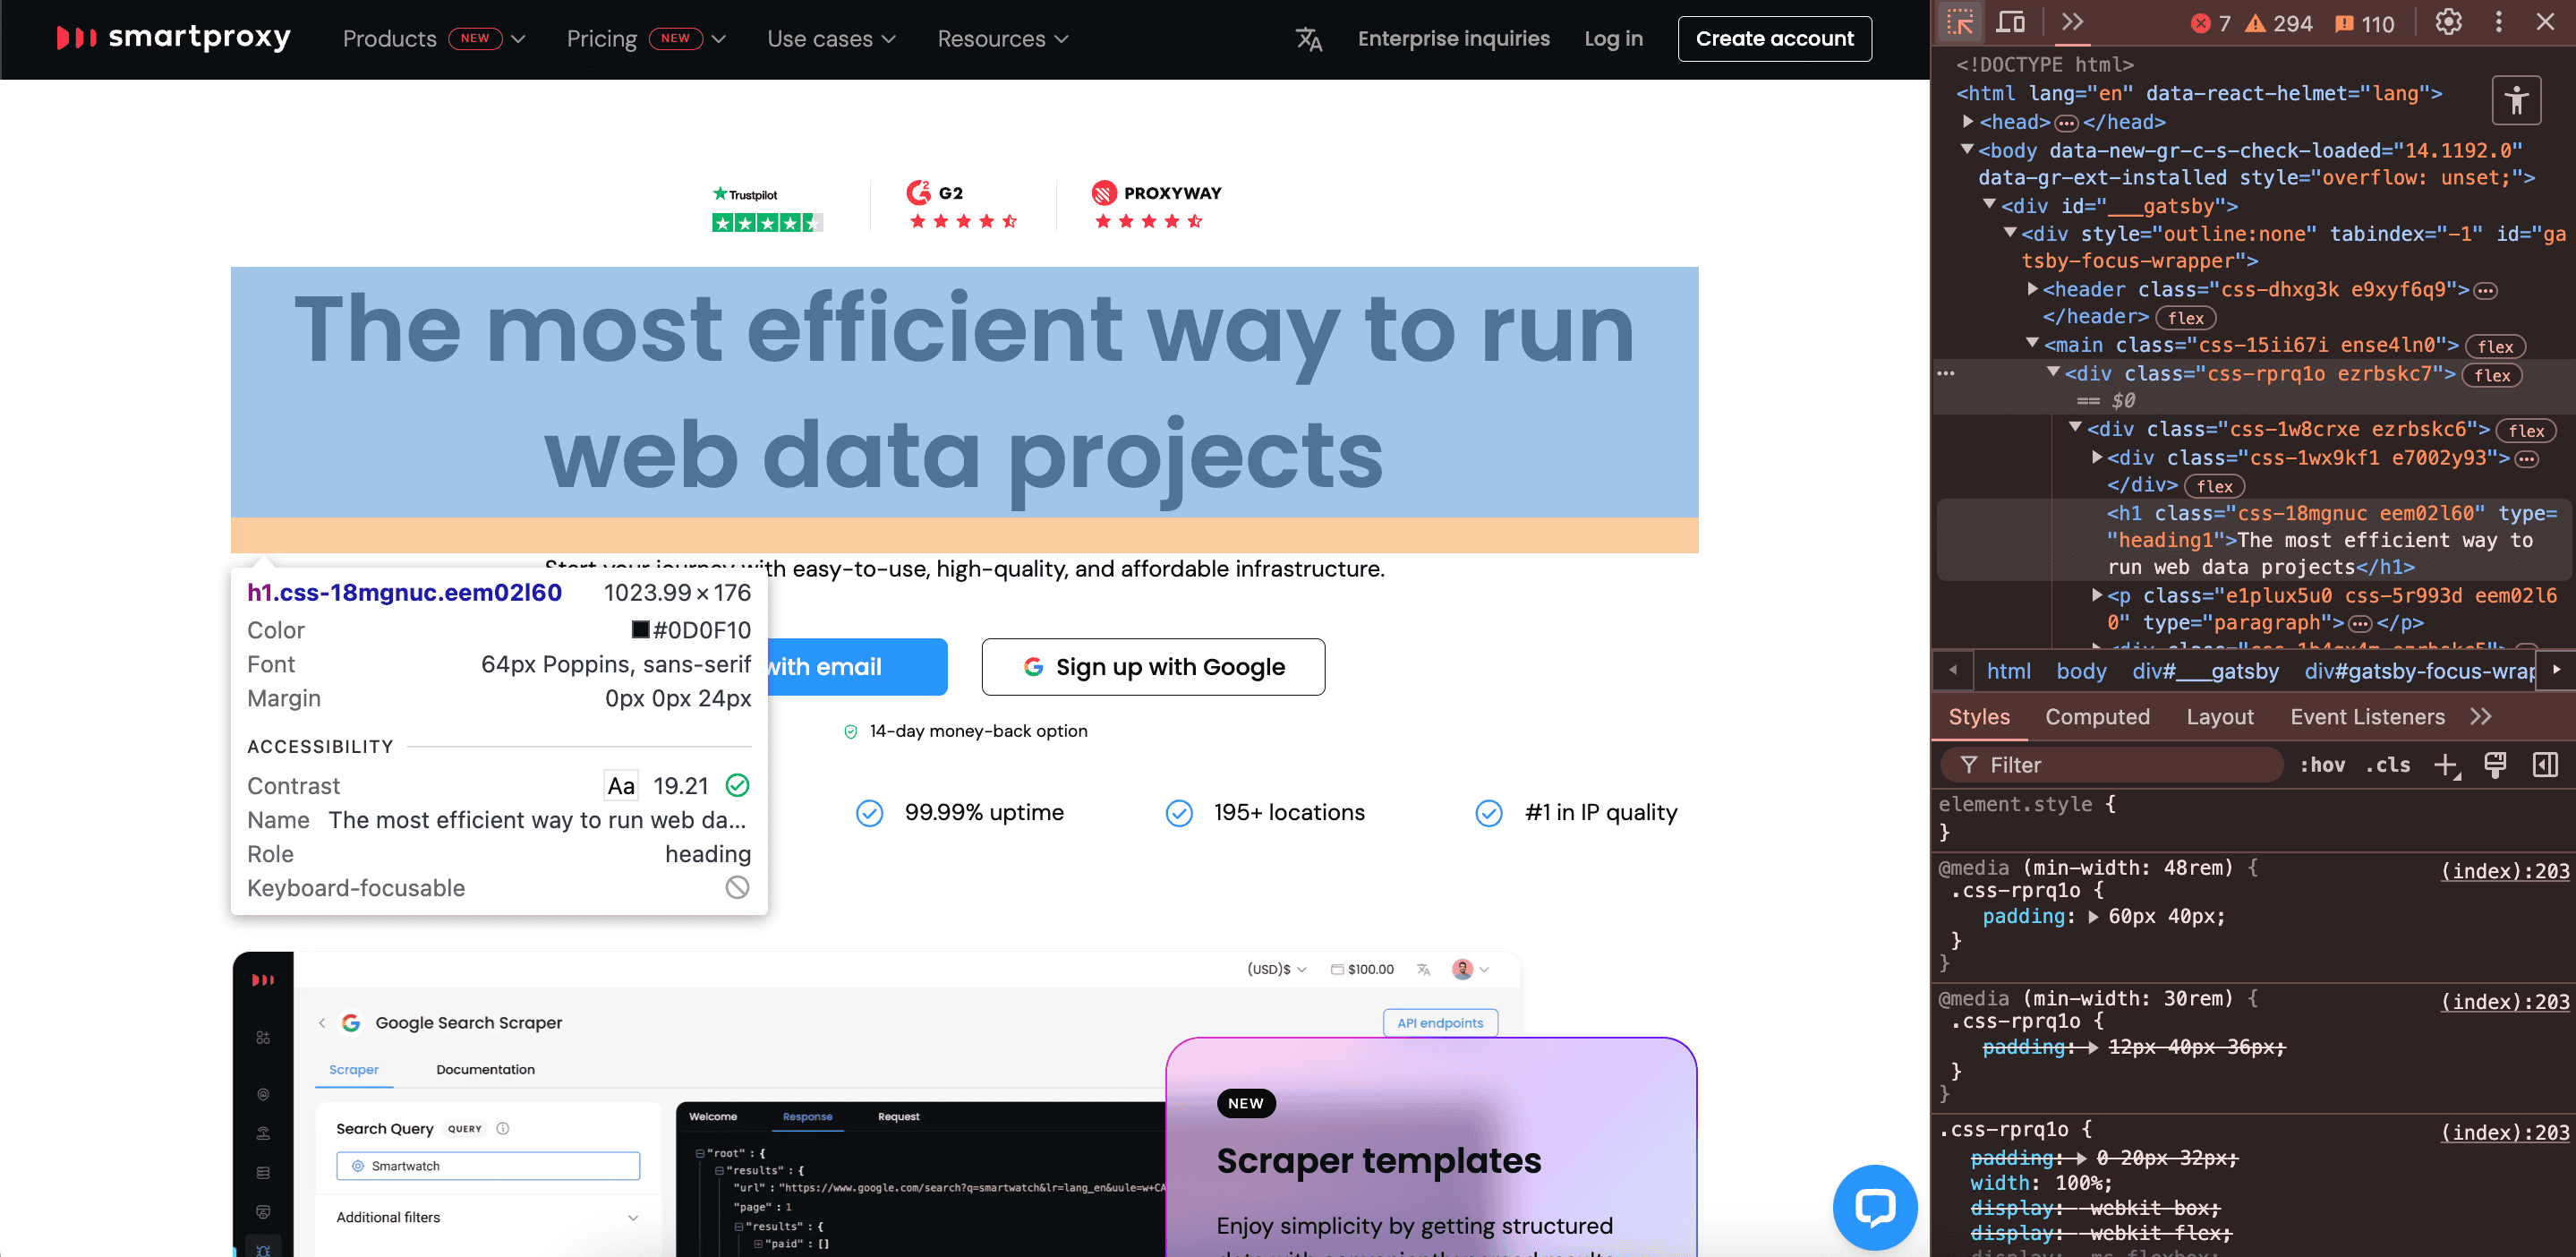
Using the Elements tab
The Elements tab in your browser’s developer tools is where you can inspect and modify the HTML and CSS of a webpage. To select and highlight elements on the page, click the little mouse icon in the upper left corner or use Ctrl+Shift+C (Windows) or Cmd+Shift+C (macOS). This lets you hover over and pick specific elements to inspect or edit.
You can also view how a webpage looks across different screen sizes by toggling Device Mode by clicking the little device icon in the upper left corner or using Ctrl+Shift+M (Windows) or Cmd+Shift+M (macOS). As you select elements, the corresponding CSS rules are displayed in the panel, making it easy to tweak styles on the fly.
Beyond inspecting and editing webpage elements, the Elements tab is also incredibly useful for copying elements to use in your web scraping code. Once you’ve selected an element using Ctrl+Shift+C (Windows) or Cmd+Shift+C (macOS), you can right-click on it within the Elements tab and navigate to Copy to access various options like Copy Outer HTML, Copy selector, or Copy XPath.
Your copied snippets can be directly used in your web scraping scripts to accurately target the data you need. For example, you might use the Copy selector option to retrieve a unique CSS selector that helps your scraping code pinpoint the exact data element on the page.
Using the Sources tab
The Sources tab is where you can browse and view all the files that make up a webpage, including its HTML, CSS, JavaScript, and media files. This tab is particularly useful for inspecting JavaScript files to understand how scripts are executed on the page. You can set breakpoints, step through code line by line, and debug scripts directly within the browser, which is great for developers working with complex web applications.
You can also use Ctrl+P (Windows) or Cmd+P (macOS) to quickly search for specific content within the Sources tab, like JavaScript files, to locate and inspect the code responsible for certain functionality.
Using the Network tab
The Network tab allows you to monitor and analyze all network activity as the webpage loads. You can see every request made by the page, including files, scripts, images, and API calls. This real-time view helps you understand what resources are being loaded, how long they take, and whether any errors occur.
This real-time view is excellent for optimizing page performance (load times) and troubleshooting issues with content delivery. You can use Ctrl+E (Windows) or Cmd+E (macOS) to quickly toggle network recording on and off, helping you capture only the data you need.
Using the Application tab
In the Application tab, you can view and manage data stored in your browser, including cookies, local storage, and session storage. This tab is especially useful for inspecting cookies (small pieces of data stored by websites to keep track of user sessions, preferences, and other information). You can view, edit, and delete cookies to test how a website handles user data and compliance with privacy regulations.
For example, you can experiment with clearing the cache or deleting specific cookies to observe how a website behaves without them – an approach helpful for testing login sessions or how personalized content is delivered. Additionally, you can view and edit the data in the IndexedDB section, which some websites use to store large amounts of structured data for offline access.
To sum up
The "Inspect Element" feature is a powerful tool that allows you to analyze, debug, and modify the underlying code of any webpage in real time. It provides invaluable insights into the structure and behavior of websites, which is especially useful for writing web scraping code. By enabling you to interact directly with a webpage’s HTML, CSS, and JavaScript, "Inspect Element" can help you identify and extract the webpage data you need.
About the author

Dominykas Niaura
Technical Copywriter
Dominykas brings a unique blend of philosophical insight and technical expertise to his writing. Starting his career as a film critic and music industry copywriter, he's now an expert in making complex proxy and web scraping concepts accessible to everyone.
Connect with Dominykas via LinkedIn
All information on Smartproxy Blog is provided on an as is basis and for informational purposes only. We make no representation and disclaim all liability with respect to your use of any information contained on Smartproxy Blog or any third-party websites that may belinked therein.