Data Lake
A data lake is a centralized repository that stores large volumes of raw, unstructured, and structured data. It allows data to be stored in its original format until needed. Data lakes are scalable, cost-effective, and support analytics, machine learning, and real-time processing. They are commonly used for big data and advanced analytics.
Also known as: Data Repository, Data Storage Pool, Big Data Storage, Raw Data Hub.
Comparisons
- Data Lake vs. Data Warehouse. Data Lake stores raw, unstructured, and structured data for flexibility. Data Warehouse stores only processed and structured data optimized for analytics.
- Data Lake vs. Database. Data Lake handles vast amounts of diverse data types for large-scale analytics. Database focuses on structured data for operational purposes with strict querying.
- Data Lake vs. Data Mart. Data Lake is a centralized repository for all data. Data Mart is a subset of data, tailored for specific business teams or use cases.
- Data Lake vs. File Storage System. Data Lake organizes data with metadata for easy retrieval and analysis. File Storage System stores files without advanced metadata or analytics features.
- Data Lake vs. Cloud Storage. Data Lake is designed for analytics and big data workloads. Cloud Storage is general-purpose storage for files, documents, and backups.
Pros
- Improved Scalability. Sharding distributes data across multiple servers, allowing the system to handle larger datasets and more users.
- Enhanced Performance. By splitting data, queries can target specific shards, reducing response times and load on individual servers.
- Fault Isolation. Issues in one shard do not typically affect the others, increasing system reliability.
- Cost Efficiency. Allows the use of smaller, less expensive servers instead of investing in a single high-powered machine.
- Flexibility in Scaling. New shards can be added as the dataset grows, providing a clear path for horizontal scaling.
Cons
- Complexity. Managing and organizing a data lake requires robust governance and technical expertise.
- Data Quality Issues. Without proper oversight, data lakes can become "data swamps," filled with redundant or low-quality data.
- Lack of Optimization. Querying raw data can be slower compared to processed data in a data warehouse.
- Security Challenges. Large amounts of sensitive raw data increase the need for stringent access control and encryption.
- Steep Learning Curve. Requires knowledge of big data tools (e.g., Hadoop, Spark) and architecture to maximize benefits.
- Not Ideal for Transactional Use. Lacks the speed and structure needed for operational or transactional systems.
Example
Scenario: A retail company wants to analyze customer behavior to improve marketing strategies and predict sales trends.
Steps in Using a Data Lake:
- Data Collection. The company collects diverse data from multiple sources:
- Customer purchase history (structured data).
- Social media interactions (semi-structured data, like JSON).
- Clickstream data from their website (unstructured data).
- Images and videos from customer product reviews (unstructured data).
- Data Storage in the Data Lake:
- All this data is ingested into the data lake (e.g., Amazon S3, Azure Data Lake, or Hadoop HDFS) in its raw format.
- Metadata tags are applied to categorize the data (e.g., "purchases," "social_media," "clickstream").
- Data Processing:
- Data engineers use big data tools like Apache Spark or AWS Glue to process and clean the data when needed.
- For example, customer purchase data is aggregated to calculate total spending per user.
- Data Analysis:
- Data scientists run machine learning models directly on the raw clickstream and purchase data to predict future sales trends.
- Marketing teams analyze social media data to determine which products are trending.
- Real-Time Insights:
- Streaming tools (e.g., Kafka) process clickstream data in real-time to recommend products on the website.
- Visualization and Reporting:
- Processed data is sent to visualization tools (e.g., Tableau or Power BI) to create dashboards for the executive team.
Example
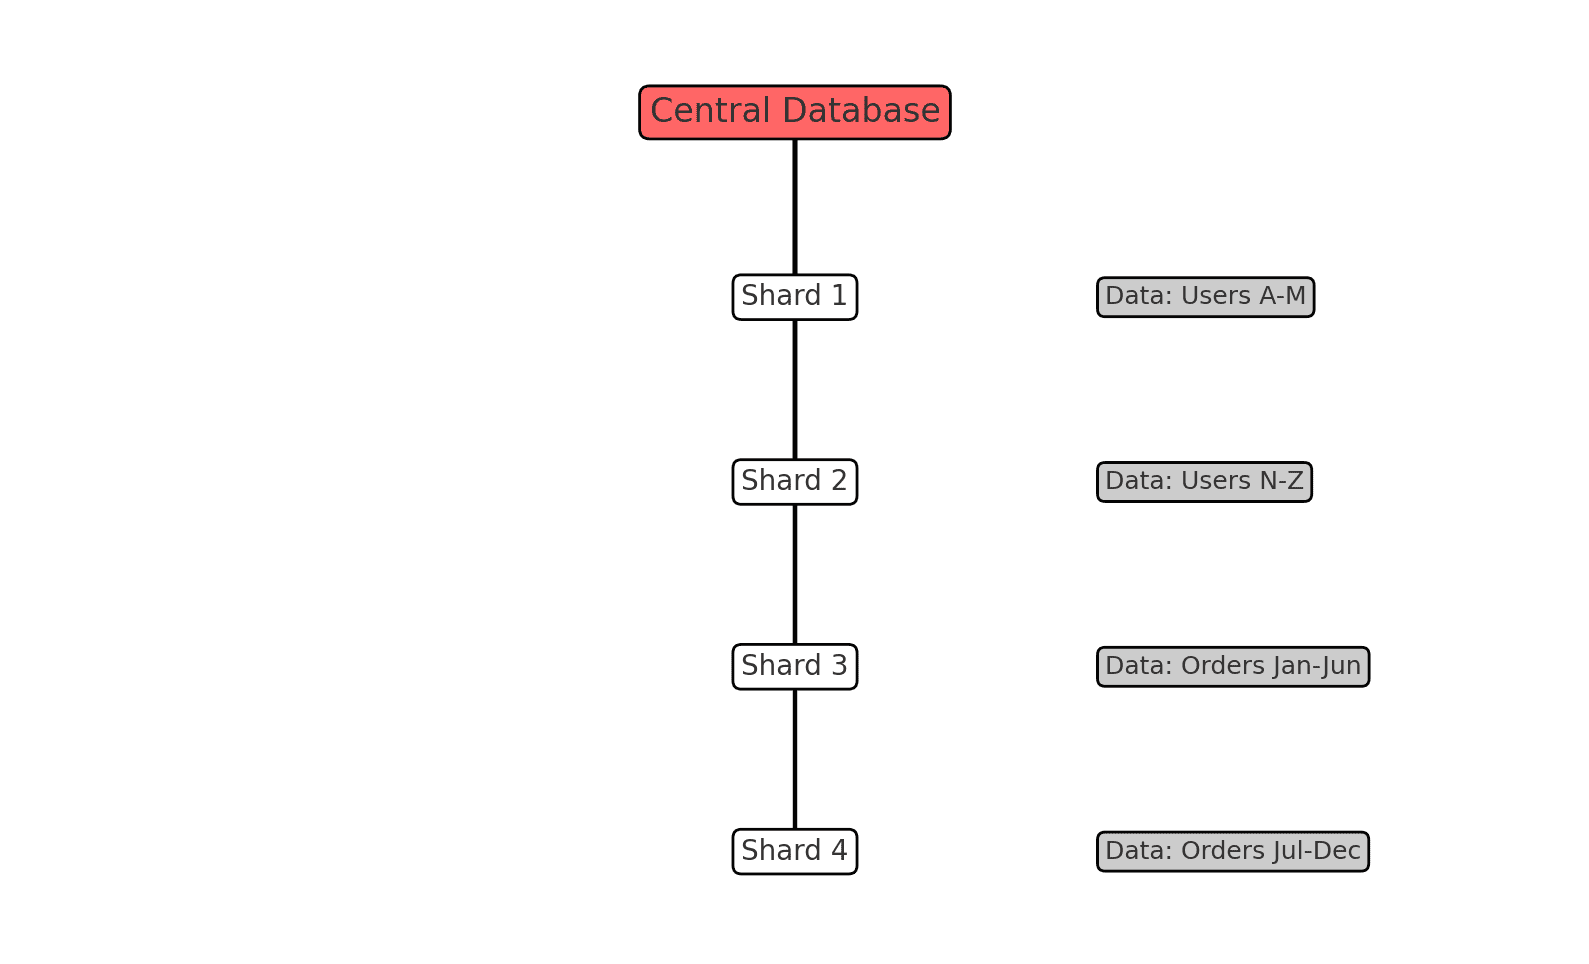
Here is a visual representation of how sharding works. The central database distributes different portions of the dataset (e.g., users or orders) across multiple shards. Each shard stores a distinct subset of the data, enabling scalability and efficient data access.


