


New Proxy Statistics on the Smartproxy Dashboard
If you’re using our residential or datacenter proxies, you know how important it is to keep track of your traffic usage. Understanding traffic usage patterns is vital for optimizing projects and making informed decisions. That's why we're excited to introduce a few improvements in monitoring your traffic statistics on the dashboard!
Statistics tab
So, what’s new? First, when you click on Residential or Datacenter on the left-side panel of the dashboard, you’ll be able to select a new Statistics tab. There you’ll see your Top 10 targets for which you’ve spent the most traffic across all users, or you can choose Users and select a specific user to view the data that applies to it.
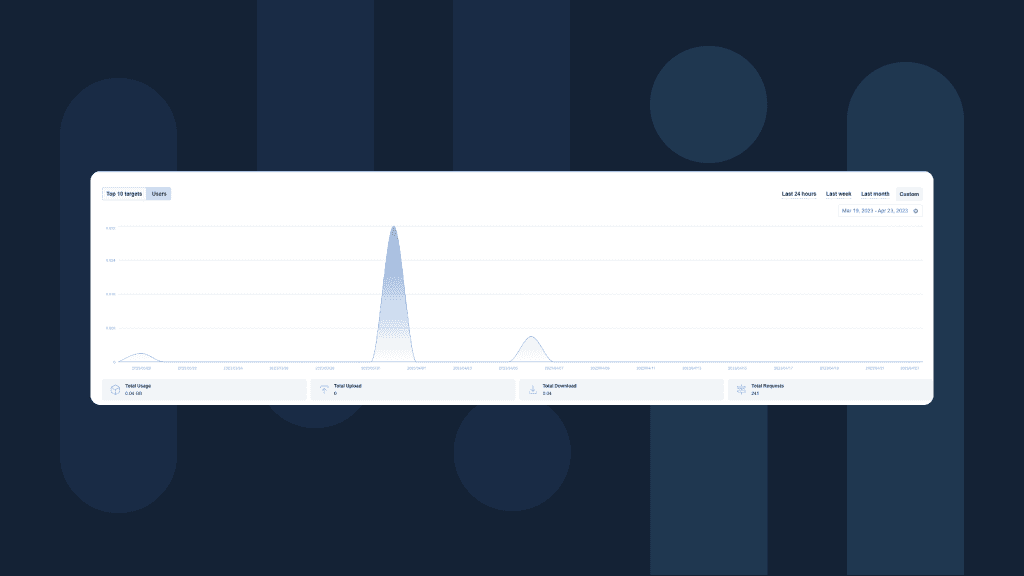
The graph
The graph visually depicts your traffic usage over a certain time for one or all of your users. You can specify the user on the left side. Meanwhile, you can set the period on the right side: Last 24 hours, Last week, Last month, or a Custom range. You can hover over the curve with your mouse cursor (or tap on it if you’re on a mobile or tablet device) to see the date and usage, download, and upload amounts in GBs.
Under the graph, you’ll find some overall metrics that span your specified date:
- Total Usage,
- Total Upload,
- Total Download,
- Total Requests.
The table
Scroll down and take a closer look at your targets by checking out the table at the bottom of the page. Here, you can see your top targets with Date, Usage, Upload traffic, Download traffic, and Requests information. Sort the table according to any of these metrics by clicking on the respective column headings and easily analyze your traffic data in different ways.
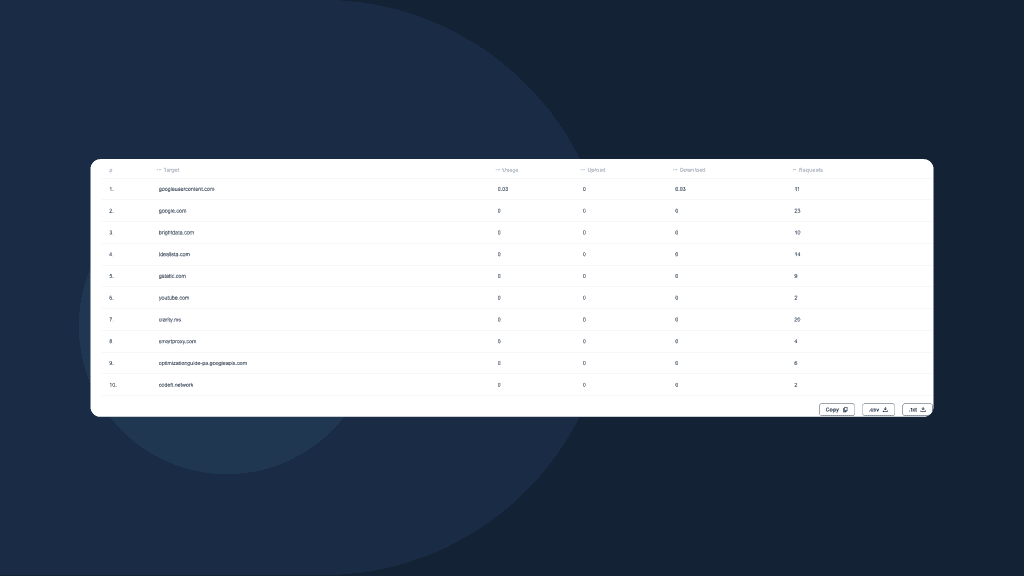
If you’ve sent requests for more than ten targets, you’ll see a pagination with ten items per page on the left side under the table. Meanwhile, on the right side, you’ll find buttons to copy the table information to the clipboard and export it in .csv and .txt formats.
To sum up
Our new traffic usage improvements offer a range of features to help you better understand and optimize your usage of our proxies. With this access to detailed information and convenient sorting and exporting tools, you can finally nerd out on your statistics and take your proxy performance up a notch!
About the author

James Keenan
Senior content writer
The automation and anonymity evangelist at Smartproxy. He believes in data freedom and everyone’s right to become a self-starter. James is here to share knowledge and help you succeed with residential proxies.
All information on Smartproxy Blog is provided on an as is basis and for informational purposes only. We make no representation and disclaim all liability with respect to your use of any information contained on Smartproxy Blog or any third-party websites that may belinked therein.